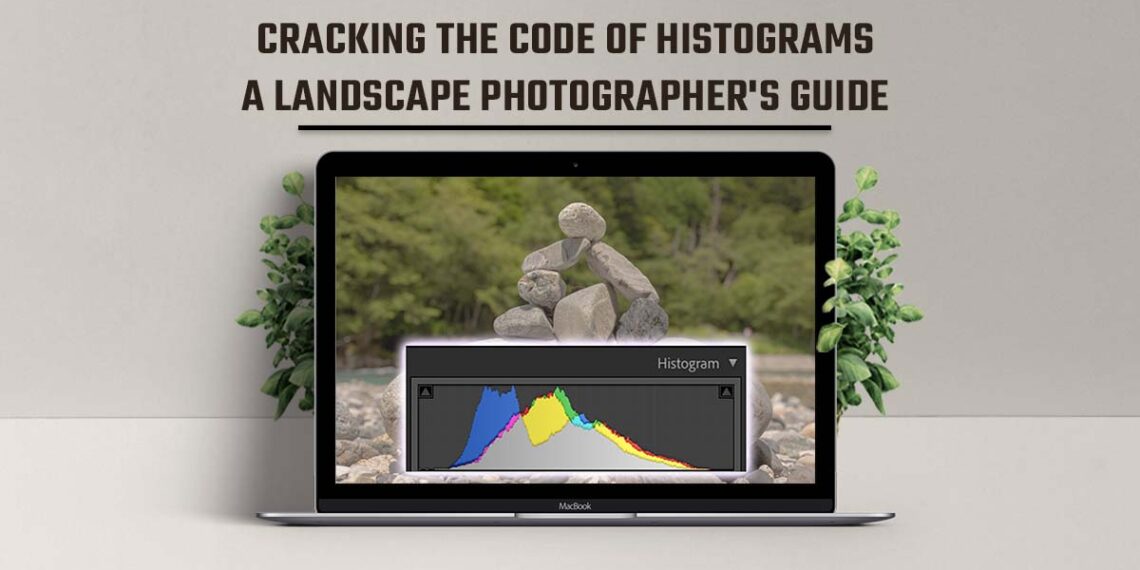
Have you ever looked at your camera’s histogram and felt utterly lost? Histogram can initially seem daunting, especially if you’re new to photography. But once you understand how they work, you’ll wonder how you ever managed without them.
With a histogram, you can quickly and easily assess the exposure of a photo, even in tricky lighting conditions. This is especially important for landscape photography, where the dynamic range of light can be challenging to capture.
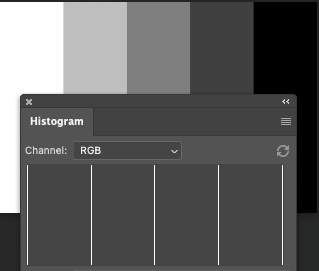
In this article, I’ll take you through everything you need to know about histograms in landscape photography. I’ll start with the basics of histogram and how they work. And then dive into the nitty-gritty of how to read and interpret histogram in different lighting situations. By the end of this guide, you will have the knowledge you need to take perfectly exposed landscape photos every time.
💡Note: It is also a good idea to learn about the exposure triangle and composition techniques. Combining all these together will be a huge win.
What is Histogram?
In simple terms, a histogram is a graph showing the light distribution in an image.
In photography, a histogram is a graphical representation of the distribution of tones in an image. Histograms are helpful because they allow you to see an image’s overall brightness and contrast at a glance and adjust the exposure accordingly.
How does histogram Work in Photography?
When you take a photo, your camera records the brightness level of each pixel in the image. The histogram then shows you how many pixels there are at each brightness level. The graph plots the number of pixels at each brightness level, ranging from black (0) to white (255), and shows how the distribution of pixels across the range of brightness levels.
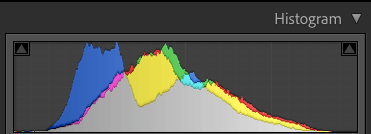
A “well-exposed” photo will have a histogram that distributes evenly across the range of brightness levels, with no areas bunched up at either end. This means that no areas of the image are overexposed (i.e., blown out) or underexposed (i.e., too dark). Instead, the image has a good balance of bright and dark areas, which results in an image that is visually pleasing and well-lit.
Importance of Understanding Histogram in Photography
Understanding histograms is crucial for achieving perfect exposure in landscape photography. By reading the histogram, you can see if your photo is too dark, or too bright) or just right. This information allows you to adjust your camera settings and take better photos.
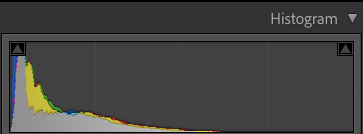
Histograms are particularly important in landscape photography, where the dynamic range of the scene can be vast. In such situations, capturing all the details in the highlights and shadows of the image is difficult without overexposing or underexposing certain parts. Analysing the histogram makes it easy to determine whether the image is exposing correctly or not and make adjustments accordingly.
💥Fun Fact: The term “histogram” was coined by Karl Pearson, a British mathematician, in 1895. Pearson used histograms to represent data in his studies of genetics, and the concept was later applied to photography. Today, histograms are a vital tool for photographers in all genres. Now it is an integrated feature in most digital and mirrorless cameras.
How to Read a Histogram in Photography
As I mentioned, Histograms are graphical representations of the tonal values in an image, arranged in a graph format that shows how bright or dark different parts of the image are.
Understanding how to read histograms is crucial for achieving perfect exposure in landscape photography. In this section, we will dive deeper into how to read histograms.
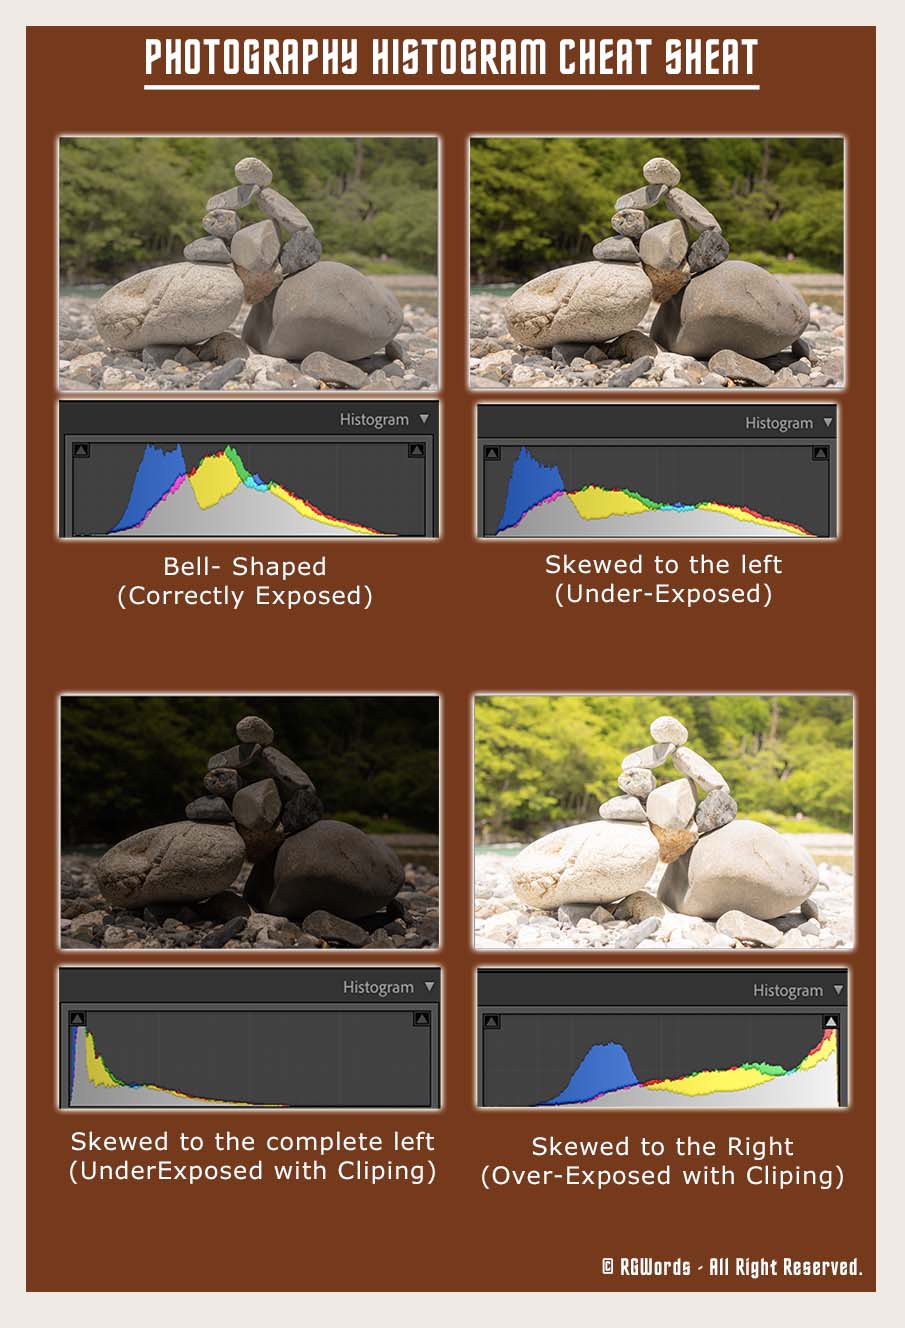
What different shapes of histogram mean:
To start, let’s understand the x-axis and y-axis of histograms.
The x-axis shows the brightness values of the image, ranging from dark shadows on the left side to bright highlights on the right side.
The y-axis shows the number of pixels at each brightness level.
With the combination of different x & y axis values, histograms come in different shapes. Such as bell curves, humps, and spikes, which indicate different tonal distributions in the image.
Histograms can have different shapes depending on the distribution of light and dark tones in the image. Here are a few common shapes and what they can indicate:
- Bell-shaped: This is a common shape for histograms and indicates a well-exposed image with a good balance of shadow and highlight detail.
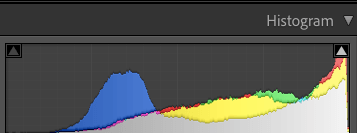
- Right Skewed Histogram: This shape indicates an image that is overexposed with too much bright detail and not enough shadow detail.
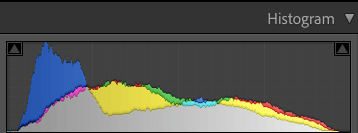
- Left Skewed Histogram: This shape indicates an image that is underexposed with too much shadow detail and not enough bright detail.
- Bimodal: This shape indicates an image with two distinct tonal ranges, which could result from a composite image or a scene with very different lighting conditions.
By understanding how to read histograms and interpret their shapes, you can make more informed exposure adjustments in your landscape photography.
Tips for interpreting histograms and making exposure adjustments:
Interpreting histograms can be challenging, but there are some tips to make it easier.
- Use the histogram as a guide: Firstly, aim for a histogram with a balanced distribution of shadows, mid-tones, and highlights. The histogram can help you determine if your image is overexposed, underexposed, or well-exposed, and you can make exposure adjustments accordingly.
- Pay attention to the highlights and shadows: Secondly, pay attention to the highlights, as they are the easiest part of the image to overexpose.
- If the histogram shows a spike on the right side, it means the highlights are clipped or overexposed, and you need to adjust the exposure accordingly to reduce light.
- If your histogram is skewed to the left side, it means the image is underexposed and requires more light, and you may need to adjust your exposure to bring out more detail in the shadows.
- Shoot in RAW: Shooting in RAW gives you more latitude to adjust exposure in post-processing without sacrificing image quality.
- Experiment with exposure compensation: If you need help adjusting your exposure, try using exposure compensation to make small adjustments and see how they affect the histogram.
💥Fun Fact: Histograms were originally used in science and engineering to represent data. However, with the advent of digital photography, histograms have become an essential tool for photographers to evaluate exposure and adjust settings.
Using Histograms in Landscape Photography
Histograms can be a powerful tool for achieving perfect exposure in landscape photography. Here’s how to use them step-by-step:
Step-by-Step Guide to Using Histograms in Landscape Photography
- Set your camera to shoot in RAW format always. It gives you the most information to work with when editing your images. You can be able to more pull details in shadows and highlights.
- Start with a test shot of your scene. This will give you a baseline histogram to work with.
- Review the histogram on your camera’s LCD screen. Look for any spikes or gaps in the histogram that indicate overexposed or underexposed areas.
- Adjust your camera settings as needed. If you see overexposed areas on the histogram, you’ll need to decrease your exposure by adjusting your shutter speed, aperture, or ISO. If you see underexposed areas, you’ll need to increase your exposure.
- Take another test shot and review the histogram again. Continue making adjustments as needed until you have a well-exposed image.
- Review your final image on your camera’s LCD screen. And check the histogram one last time to ensure you have a good exposure.
By following these steps, you can use histograms to ensure you get the best exposure in your landscape photography.
Recommendations for Adjusting Exposure Settings Based on Histogram Readings
- If the histogram is on the left side (the image is underexposed), adjust the shutter speed or aperture to increase the exposure.
- Suppose the histogram is on the right side (the image is overexposed), adjust the shutter speed or aperture to decrease the exposure.
- If the histogram is in the middle, the exposure is likely correct.
Examples of Using Histograms in Different Lighting Conditions
- Low-light conditions – the histogram pushes towards the left side due to underexposure. To fix this, you should use a slower shutter speed, a wider aperture, or increase your camera’s ISO setting.
- High/bright light conditions – the histogram pushes towards the right side due to overexposure. To fix this, you should use a faster shutter speed, a smaller aperture, or decrease your camera’s ISO setting.
- Mixed lighting conditions – the histogram may show a peak distribution on both the left and right sides, which can be tricky to correct. One solution is to take multiple exposures and blend them together in post-processing to achieve the desired result. Another name for this method is HDR or exposure stacking.
Read our detail guide how light make or break your landscape photography.
My top recommendation as a landscape photographer
As a professional landscape photographer, I’ve found histograms indispensable in achieving the perfect exposure. I always refer to the histogram while shooting to ensure that my images have the right amount of light and contrast. Even with the current mirrorless camera, you can see the live histogram in both viewfinders and in the back LCD.
Here are some tips based on my personal experience of using histograms in daily photography:
- Expose to the right: Exposing to the right means intentionally overexposing your image slightly to capture more detail in the brighter areas of the scene. This technique is particularly useful when shooting landscapes with a lot of contrast.
- Use exposure compensation: If your camera’s metering system is consistently over or underexposing your images, use exposure compensation to adjust the exposure settings accordingly.
- Check the histogram constantly: Always check the histogram after a shot to ensure the exposure is correct. If the histogram shows the image is over or underexposed, adjust the exposure settings and take another shot.
Using histograms in your landscape photography ensures that your images are exposing correctly and have the right amount of light and contrast. With practice, you’ll learn to read histograms quickly and make exposure adjustments on the fly.
Conclusion
Histograms are essential for landscape photographers who want to achieve perfect exposure in their shots. Understanding how histograms work, reading them correctly. And using them to adjust exposure settings can help you capture stunning and well-exposed images.
To summarize, histograms are graphs that represent the tonal distribution of an image. With the x-axis representing the brightness levels and the y-axis representing the number of pixels at each brightness level. Different shapes of histograms indicate different exposure settings, with a well-exposed image having a balanced histogram distributed evenly across the range.
In conclusion, understanding histograms is crucial to achieving perfect exposure in landscape photography. By following the tips and techniques shared in this guide, you can use histograms effectively in your photography. Remember to share your own experiences with histograms in the comments section, and happy shooting!


